Create health dashboard using time based data
This article is about how to create a dashboard using log data. We want to analyze relevant time-sensitive data in a dynamic and visually meaningful way.
Use case
An example application is when an application or script feeds data from various endpoints or microservices via a central logging solution and this data is then to be visualized. You can find more information about a simple and scalable solution for central log management here: Centralize log collect... | LNC DOCS (lucanoahcaprez.ch)
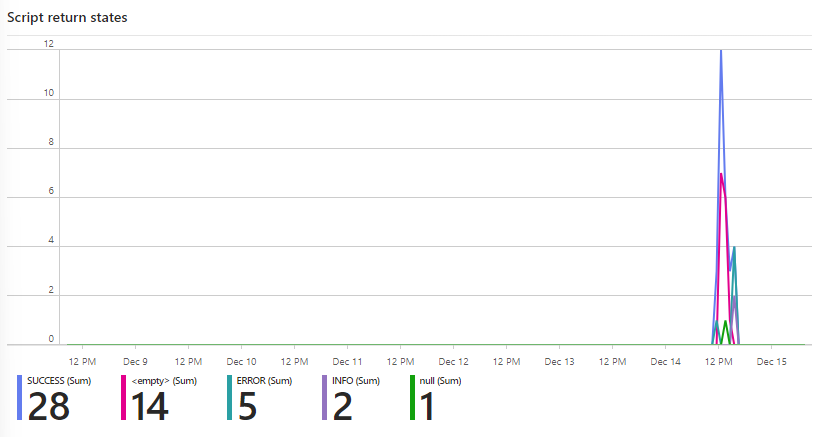
This example graph displays values of a PowerShell script that runs at the log in of a user. The script then has statuses, which are then written to an Azure Log Analytics Workspace. This diagram can now be used to see when which status was created.