Quick Start Guide for Azure Workbooks
Azure Workbooks are a powerful tool for building interactive dashboards and visualizing data at scale. This guide provides you with a structured, practical approach to deploying and managing Azure Workbooks, based on real-world experience and best practices.
Use case
In today's data-driven world, cloud services like Azure, Microsoft 365 and others provide a wealth of data waiting to be analyzed. Azure Log Analytics, powered by Kusto Query Language (KQL), enables users to explore and visualize data effectively. Azure Workbooks are ideal for building KPI dashboards, providing health overviews of systems, analyzing historical trends, monitoring security and compliance, delivering custom reports for stakeholders, and visualizing DevOps or automation metrics. Let's dive into how to leverage KQL-Based Workbooks in Azure Log Analytics to gain valuable insights through compelling graphs and diagrams.
Azure Workbooks Overview
Azure Workbooks are a flexible data visualization platform within the Azure ecosystem. They enable IT professionals to create interactive dashboards using KQL-based graphs and fetch live data from multiple sources. Since Azure Workbooks are no more than standard Azure resources this means that they can be customize with Azure RBAC permissions. Workbooks are highly portable and scalable, leveraging a JSON-based structure for easy export, import, and sharing. Filtering options via parameters allow customization for different audiences.
Key capabilities
- Aggregate data from diverse sources for unified, single-pane-of-glass monitoring.
- Integrate live data from Log Analytics, Microsoft Graph API, Azure Resource Graph, external HTTP endpoints, serverless functions, storage buckets, and third-party APIs.
- Control access with Azure RBAC for secure, role-based visibility.
- Easily scale, export, and import dashboards across environments.
- Customize dashboard views using parameter filtering.
Technology stack
Azure Workbooks are built on JSON templates work like the Azure Resource Manager (ARM) templates. Therefore it is very simple to automate it via REST APIs and the Azure Management API (https://management.azure.com). They are also compatible with Infrastructure as Code (IaC) tools such as Bicep & Terraform.
Data sourcing
Azure Workbooks support a broad range of data sources, making them highly adaptable for complex monitoring and reporting needs. This flexibility enables you to visualize and analyze data from virtually any system within your IT environment.
Built in data sources:
- Log Analytics Workspace
- Microsoft Graph API*
- Azure Resource Graph
- External HTTP Endpoints
Using the "externaldata" functionality from KQL:
- Serverless Functions
- Storage Buckets
- Third-Party APIs
For scenarios involving complex data aggregation, transformation or exotic permissions on APIs, it is best practice to offload these tasks to Azure Functions or similar serverless solutions. This approach ensures scalability and keeps your dashboards responsive, even when working with large or intricate datasets.
Graph API permission limitations
The integration of Microsoft Graph API is currently limited to these scopes (because of the service principle “Microsoft Azure AppInsightsExtension” under the hood):
- DeviceManagementApps.Read.All
- DeviceManagementConfiguration.Read.All
- DeviceManagementManagedDevices.Read.All
- Policy.Read.All
- Policy.Read.ConditionalAccess
- User.Read
- User.ReadBasic.All
- WindowsUpdates.ReadWrite.All
- profile email openid
Graph API source availability
The data source "Microsoft Graph API" is currently only available using the Advanced Editor with the adjustments of JSON values. Unfortunately it is not selectable in the GUI yet (may change soon).
|
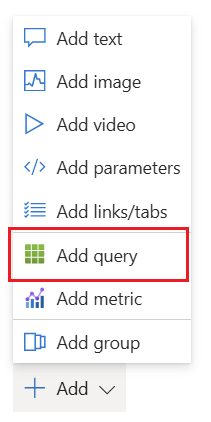
On your Azure Workbook click "Add" and select "Add query".
|
|
|
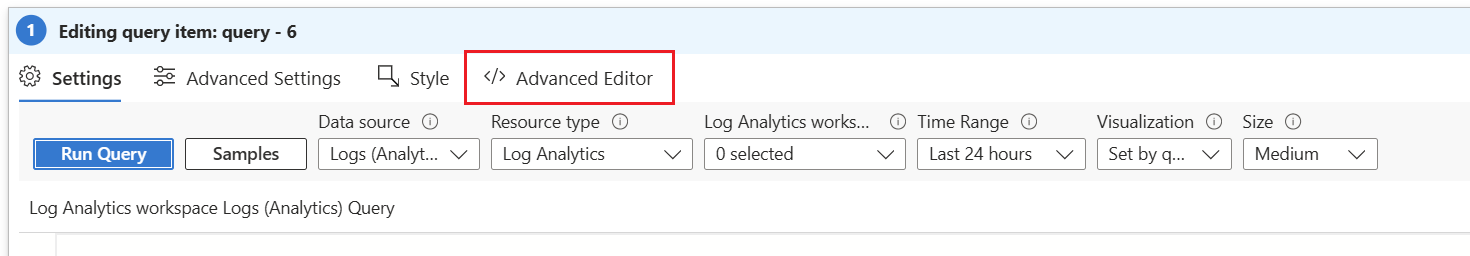
Change to "Advanced Editor" tab.
|
|
|
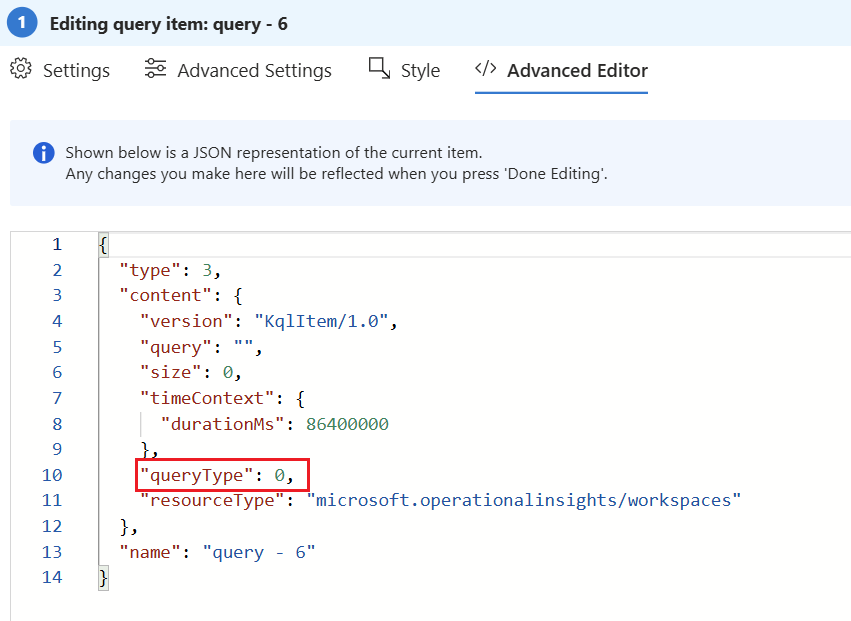
Adjust the JSON property "queryType" from 0 (default) to 14. This is the id of the Microsoft Graph API query type. Hit "Done Editing" below. |
|
|
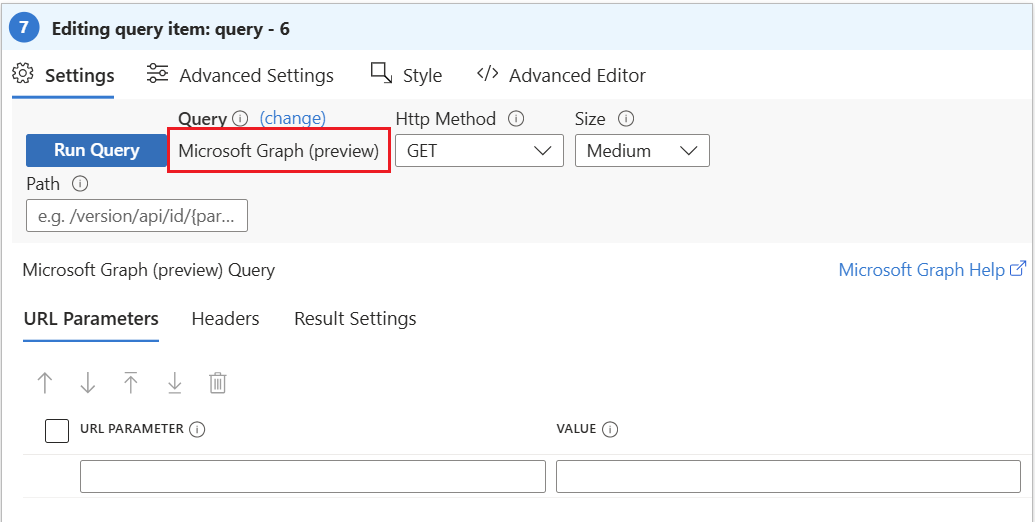
Change to the editor mode with "Edit". Now you can look under "Settings" -> "Query" that it changed to "Microsoft Graph API" query. Now you are ready to build your visualizations. |
|
Create your dashboards
- Creating an Azure Workbook: Navigate to the Azure portal and search for "Workbooks" Then create a new workbook or continue editing existing Workbooks. You can also choose from existing templates to accelerate your analysis.
-
Setting Up Azure Log Analytics (optional): Ensure you have an active Azure subscription and access to your desired data inside Azure Log Analytics workspaces. For custom logs you can create a custom Log Analytics workspace from the Azure portal and connect your data sources, such as Azure Monitor, Application Insights, or custom logs.
-
Writing KQL Queries: In the workbook, use Kusto Query Language (KQL) to craft queries that retrieve data from your Log Analytics workspace. KQL allows you to filter, aggregate, and transform data efficiently.
-
Visualization with Graphs: After querying the data, enhance your insights by creating visualizations with graphs. Choose from various graph types such as line charts, bar charts, pie charts, or area charts, depending on the data and the story you want to convey.
-
Diagram Visualization: Apart from traditional graphs, KQL-Based Workbooks enable you to create dynamic and interactive diagrams. Utilize diagrams like topology maps, network diagrams, or flowcharts to depict the relationships and dependencies within your data.
-
Interactive Controls: Enhance user experience by adding interactive controls like drop-down menus, time range selectors, or variable inputs. These controls allow users to customize and explore data on their terms.
-
Sharing and Collaboration: Share your workbook with relevant stakeholders, empowering them to view and interact with the data-driven insights. Collaborate with teams by granting them access to workbooks or exporting them for offline review.
-
Automate with Scheduled Queries: Automate data analysis by scheduling queries to run at regular intervals. This ensures that your workbooks stay up-to-date with the latest data without manual intervention.